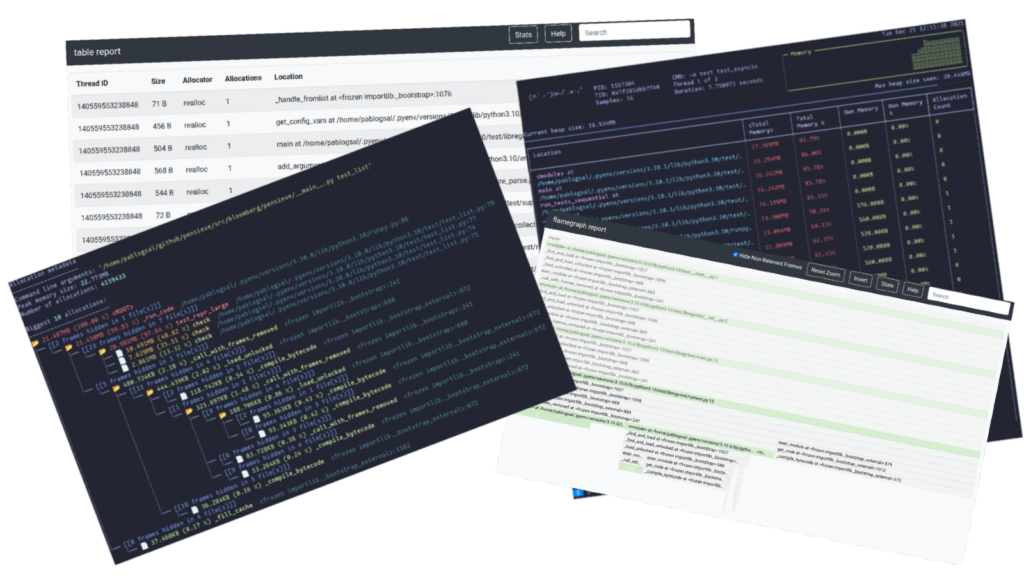
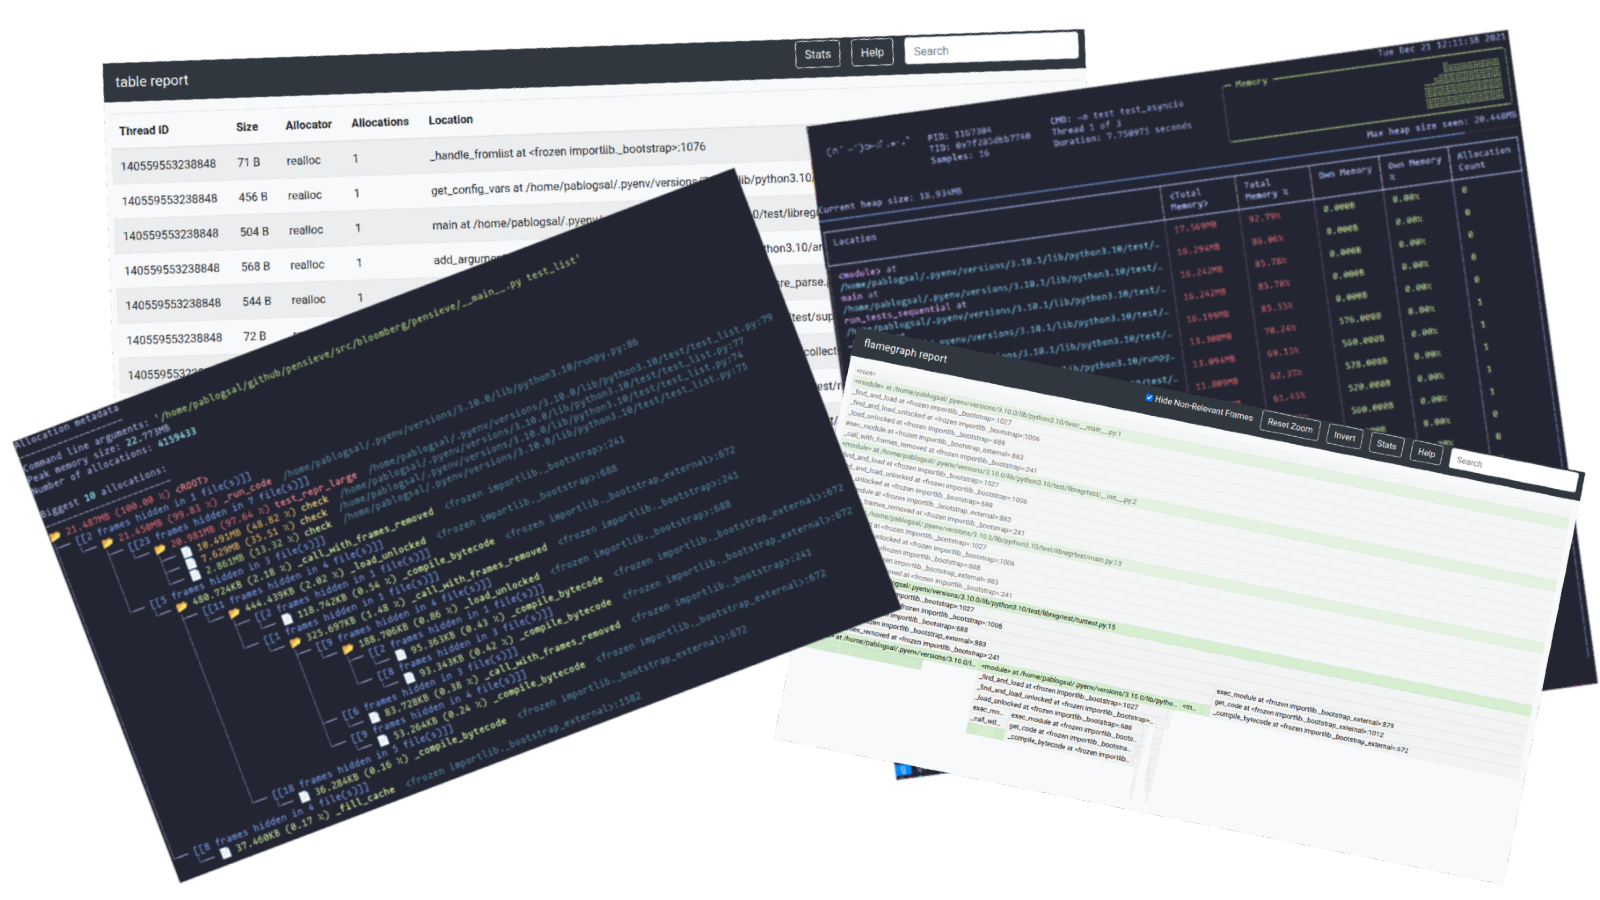
Interview: A new open-source memory profiler for Python looks set for rapid adoption. “Until now, you have never been able to get such an in-depth view of how your application allocates memory. The tool is indispensable for all long-running services implemented with Python,” mentioned Python core developer Yury Selivanov on Twitter.

Memray comes from the team at financial software and services company Bloomberg, which has 3,000 Python coders, having moved in recent years towards open source software, including Python and R.
Python is a slow language, however, there is still a lot of native code, whether it’s custom code written in C++ or libraries like Pandas and NumPy where performance-critical code is written in C.
Pablo Galindo is a software engineer at Bloomberg, which also sits on the Python Steering Council and is responsible for the release of Python 3.11, due in September.
“People don’t normally think Python is good for things like real-time market data, because we know Python isn’t the fastest language on its own, but that’s not necessary. We we tend to have a lot of C++ code running underneath and Python acts like a glue, orchestrating it all,” he told Dev Class.
Why create a new memory profiler? “There are many Python profilers out there,” adds Galindo, “but the problem is that most of these profilers don’t know about this C++ layer. They know Python but they don’t know that C and C++ exist, or the more specialized ones can see something going on but they can’t tell you how it goes, they only tell you about Python.
“Bloomberg developers came to us and said, ‘We need to optimize. Now it’s very easy to have a program that consumes like 10 GB of RAM and we have to figure out where it’s coming from and we can’t because everything that exists right now ignores this thing or can’t show us what we need.
Why not just use a native code profiler rather than one for Python? “So you have the reverse problem,” says Galindo. “You tell the profiler, ‘OK, show me where I am.’ And it’ll show you a bunch of C internals.
“If you’re on the core team, you understand, because you know how Python is done – but for a Python developer, that means nothing. What is my Python function? What’s going on?”
A native profiler “doesn’t understand what’s going on in the VM, the VM being the Python interpreter (not a virtual machine in the normal sense),” says Galindo. “Python itself is like an abstraction, the only thing running is the compiled code and what people perceive as Python is just data in the C program which is the interpreter.”
Developing Memray was a challenge, Galindo tells us, because “you are connecting two difficult worlds and we also wanted certain constraints, we wanted it to be fast, flexible and very easy to use”.
Why is memory tracking so important for performance? “Most of the time memory and speed are two streams of the equation, normally you sacrifice memory to increase speed, caching is an example of that,” says Galindo. He works with the Microsoft-sponsored CPython Faster Project, and notes that “one of the things we’re doing for 3.11 is to make the interpreter faster, but also use a bit more memory, just a little. Most optimizations have some sort of memory cost.
One problem, he says, is that developers who care about performance use more memory to fix the problem, but may not understand the cost of allocating and freeing memory because “people treat them like a black box… allocating memory actually costs time.
“The other day we had a user who came to us with a big problem. “I do this thing, it’s very slow, I use all the tools in the world and I don’t understand what’s going on .” We used Memray and found out they had a big cache, and they just freed it at some point, but in C++ to free the cache it has to visit every node, so it actually traverses a tree and it’s super slow, and they were doing [this] endlessly. They would never know, how is the release of this cache the slowness of the operation? It was an example of how these things can be useful.
Galindo also mentions a CPython memory leak issue that was fixed last year, noting at the time that “it could have been a nightmare to track down since the leak occurs in very old code that is quite complex but quite funny, I’ve tracked this super efficiently with the memory profiler which tracks Python and C at the same time, I’m building at work with my team.”
There are a few things to note about Memray. It works well regardless of the language used on the native side, be it C++ or Rust or other languages, says Galindo. It’s also Linux only.
“It’s the price to pay for being fast and very low level, you tie yourself to the platform a lot,” he adds. “There’s a lot of knowledge about linkers and compilers, and that’s platform specific. It is not architecture specific, so it works on Arm64.
That said, Windows users can use WSL (Windows Subsystem for Linux) and on macOS, Docker. “I develop Memray on Mac. I use Docker,” Galindo reveals.

